
Power BI is a business analytics tool used to analyze data and share insights, while Python is a high-level programming language used for data analysis, data visualization, and machine learning. Both have their own unique features, benefits, and drawbacks. Understanding what these two tools offer is critical to determine which is better suited to one’s needs.
Gibbs Reflective Model is a valuable tool for guiding critical thinking and reflection -here is how I applied it to reflect on using Python and Microsoft Power BI for data analysis:
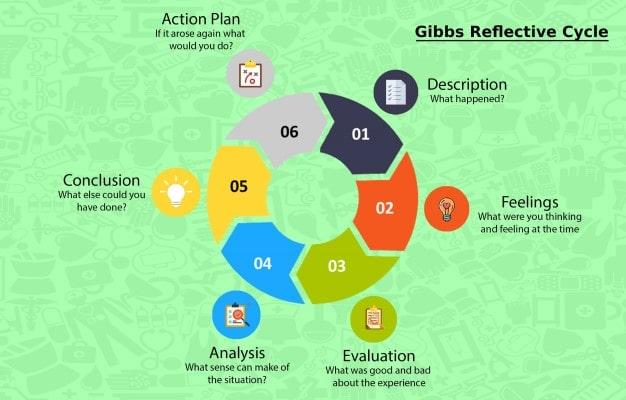
Description:
I recently used Python and Microsoft Power BI for data analysis on a project at work. Power BI is a business analytics service that provides interactive visualizations and business intelligence capabilities with an interface simple enough for end users to create their own reports and dashboards. Python is a popular programming language commonly used in data science and machine learning applications. I used Python to clean, manipulate, and analyze the data for the project.
Feelings:
I felt excited to learn new skills and tools for data analysis. However, for Power BI, I was a bit overwhelmed by the complexity of the interface and the variety of features available. I quickly jumped to use Python for data analysis as it is a powerful language with many libraries and tools. However, I also felt intimidated by the complexity of the language and the steep learning curve involved.
Evaluation:
Overall, I found that using Power BI was a highly effective approach to analysing the data. Power BI provided a wide range of visualizations and data modeling capabilities, which allowed me to gain insights into the data quickly and easily. I found that using Python provided a flexible and efficient way to manipulate and clean the data. The numerous data analysis libraries available made it easy to analyze and visualize the data.
Analysis:
The ability to create interactive dashboards with Power BI was a game-changer for the project. It allowed me to see trends and patterns in the data that would have been difficult to identify through manual analysis. I was also impressed with the ease with which I could clean, transform, and shape the data, allowing me to quickly get it into a format that could be used in the reports.
Using Python for data analysis allowed me to quickly gain insights into the data and identify trends and patterns. The flexibility of the language allowed me to customize the analysis to fit the project’s specific needs—additionally, the wide range of libraries made integrating with other data analysis tools and platforms easy.
Conclusion:
Using Python and Microsoft Power BI for data analysis was a highly effective approach. While a learning curve was involved, the end result was well worth the effort. I will continue to use Python and Power BI in the future and seek out opportunities to further improve my skills in this area.
Action Plan:
To further improve my Python and Microsoft Power BI skills, I will continue to seek opportunities to use the tools in data analysis projects. I will also look for online tutorials and courses to enhance my knowledge and proficiency. Additionally, I will explore the advanced features of Python and Power BI to become more proficient in machine learning and advanced data analysis techniques in data modeling and predictive analytics.

Pros and cons of using Python and Power BI for data analysis:

In conclusion, I consider Power BI primarily focuses on business intelligence, while Python is a versatile language that can be used more broadly in data science and machine learning. Power BI provides a purely visual interface, while Python offers more flexibility and customizability with its code. Ultimately, the choice between the two depends on your specific use case and requirements. In my case I combined Microsoft Excel with both tools on my project at work.
If I’m to make choice on both data analytical tool, I will chose Power BI because I found it easy to use and admire how it enabled me to visualized my data.


Leave a comment